Modeling oscillations and spiral waves in Dictyostelium populations
Javad Noorbakhsh, David J. Schwab, Allyson E. Sgro, Thomas Gregor, and Pankaj Mehta. Physical Review E 91: 062711 (2015).
Abstract
Unicellular organisms exhibit elaborate collective behaviors in response to environmental cues. These behaviors are controlled by complex biochemical networks within individual cells and coordinated through cell-to-cell communication. Describing these behaviors requires new mathematical models that can bridge scales—from biochemical networks within individual cells to spatially structured cellular populations. Here we present a family of “multiscale” models for the emergence of spiral waves in the social amoeba Dictyostelium discoideum. Our models exploit new experimental advances that allow for the direct measurement and manipulation of the small signaling molecule cyclic adenosine monophosphate (cAMP) used by Dictyostelium cells to coordinate behavior in cellular populations. Inspired by recent experiments, we model the Dictyostelium signaling network as an excitable system coupled to various preprocessing modules. We use this family of models to study spatially unstructured populations of “fixed” cells by constructing phase diagrams that relate the properties of population-level oscillations to parameters in the underlying biochemical network. We then briefly discuss an extension of our model that includes spatial structure and show how this naturally gives rise to spiral waves. Our models exhibit a wide range of novel phenomena. including a density-dependent frequency change, bistability, and dynamic death due to slow cAMP dynamics. Our modeling approach provides a powerful tool for bridging scales in modeling of Dictyostelium populations.
PDF.
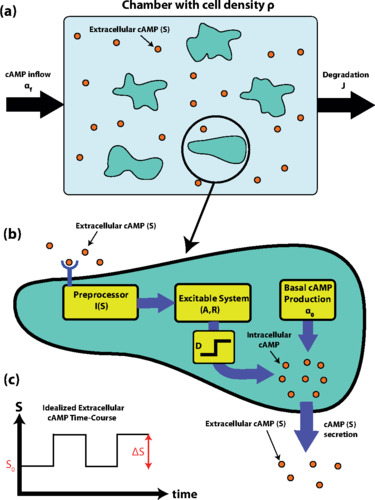 (a) Schematic of the experimental setup. A population of D. discoideumcells with density ρ is placed in a microfluidic chamber. cAMP is flown into the chamber with rateαf and the medium is washed out with rate J. The concentration of extracellular cAMP is labeled by S. Note that this schematic is to clarify the experimental setup; however, spatial structure is not modeled here and is only briefly discussed in Sec. 5. (b) Schematic of cell model. Extracellular cAMP concentration (S) is detected by the cell and preprocessed through the function I(S). The result is fed into an excitable system with internal variables A and R. The value of A is then thresholded and amplified by D to produce more cAMP for secretion. Simultaneously, cAMP is also being produced with a constant rate α0 and leaks into the extracellular environment. (c) An idealized time course of extracellular cAMP concentration (S) is shown in the large-J regime where the concentration changes according to a square wave with baseline S0 and amplitude ΔS. We refer to S0and ΔS as the background cAMP and firing-induced cAMP, respectively.
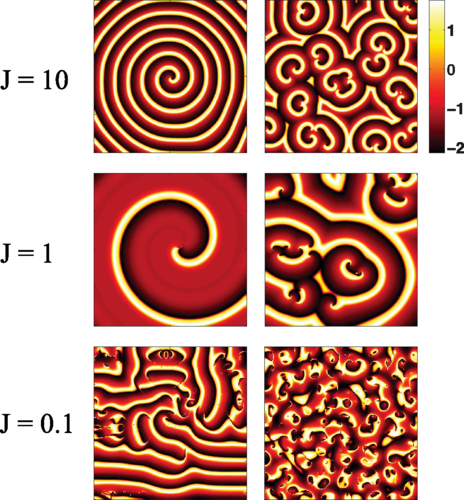 Simulation results of spatially extended model at different values of J. The colors shown represent different levels of A. Each row corresponds to a different value of J and ρ such that ρ/J remains the same. The left column corresponds to initial conditions chosen from a 2×2 coarse grid of random values that is overlayed on the simulation box . The right column shows the same simulation with initial conditions set on a 20×20 coarse grid. Parameters were kept the same as in 3 with ρ=0.1J. Simulations were done on a 100×100 box with grid spacing Δx=0.5 and time steps according to dt=Δx^2/8.